Software
 A financial Dashboard
How does your company keep on top of its cash? How do you know where your business stands in this unstable economy? How much time do you spend tracking down problems or questionable transactions in your accounting data?
Cougar Dtails – A Financial Dashboard can help you answer those questions because it provides you with the ability to gain more insight into your business data in a visual and real-time format so that you can make smart financial decisions.
What is it?
Cougar Dtails, A Financial Dashboard is our newest product, and included with the release of CMS Professional 2010. This financial dashboard is an at-a-glance visual representation of your company’s financial health. It allows you to get behind those numbers so that you can further explore what is going into that number you are seeing. Therefore providing you, business owners, CFOs and CPAs with real-time information so you all can plan for the future by better understanding your company’s financial picture and the trends over time.
How Does it Work?
Cougar Dtails, A Financial Dashboard connects to the CMS Professional 2010 General Ledger database then presents that information in graphical form in real time of the company data within customized date ranges. This financial dashboard offers 3 views:
Profit & Loss (Revenue & Expense for Nonprofits users)
Cash Flow
Financial (analysis) Indicators
And within each of these views a business owner, CFO or CPA can further drill down up to four levels on specific data for closer examination, all the way to the transaction detail if needed. Cougar Dtails is an interactive application where Assigned Users can:
set default preferences (especially if reviewing this data on a regular basis)
customize the graphs so you view only the data needed
pull the dashboard data onto an excel spreadsheet
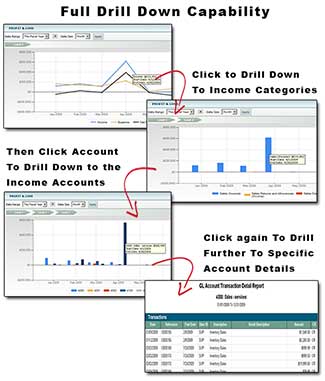
The Profit & Loss view (Revenue & Expense for nonprofit users) illustrates income (revenue) and expenses over a period of time, and a look at net profit/loss. You can view different levels of data by clicking in on the account or group you want to drill down into.
Level 1 -- is the default view and indicates the totals for income on one line, expense on a second line and net profit/loss on a third line, and is the broadest view of your data.
Level 2 -- shows a bar chart of the groups that comprise your income or expense accounts and how each group performed.
Level 3 -- shows a bar chart of each account that makes up the report group you selected and how each account within the group performed.
Level 4 -- display a transaction report for the selected account. This is the same information you would see on the GL Audit Trail report.
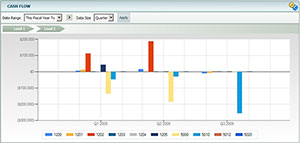
The Cash Flow view shows the relationship between cash and liabilities by graphically displaying all the accounts and account groups that impact cash. It also shows the cash fluctuations a business experiences over time, so that a company can better predict and prepare for their future cash needs, such as: Does your business need to get a head start securing financing before bills come due?
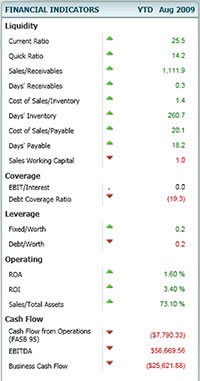
The Financial Indicators is an at-a-glance financial analysis of your company by comparing it to the previous year’s performance. This view presents a visual format as to how your financial ratios are changing – your Liquidity, Coverage, Leverage, Operations, Cash Flow and presents indicators to show whether your financial health is improving or not.
These are the same numbers a bank looks at when determining if a company qualifies for a loan or line of credit. Therefore you can now easily see yourself whether you have the proper ammo to go to the bank or whether you need to work on adjusting something within your business.
What's Next?
More dashboards – in future releases! With this latest feature Cougar Mountain Software now has the technology and the platform in which to build many more dashboards. For instance, how about A Sales Dashboard that might present visually a view of your sales history? Or A Financial Dashboard for Denali?
To print or view this page offline, it is also available as a PDF download.
Cougar Mountain Software
An ideal accounting solution if simple bookkeeping and reporting functions are no longer sufficient enough for you to remain competitive.